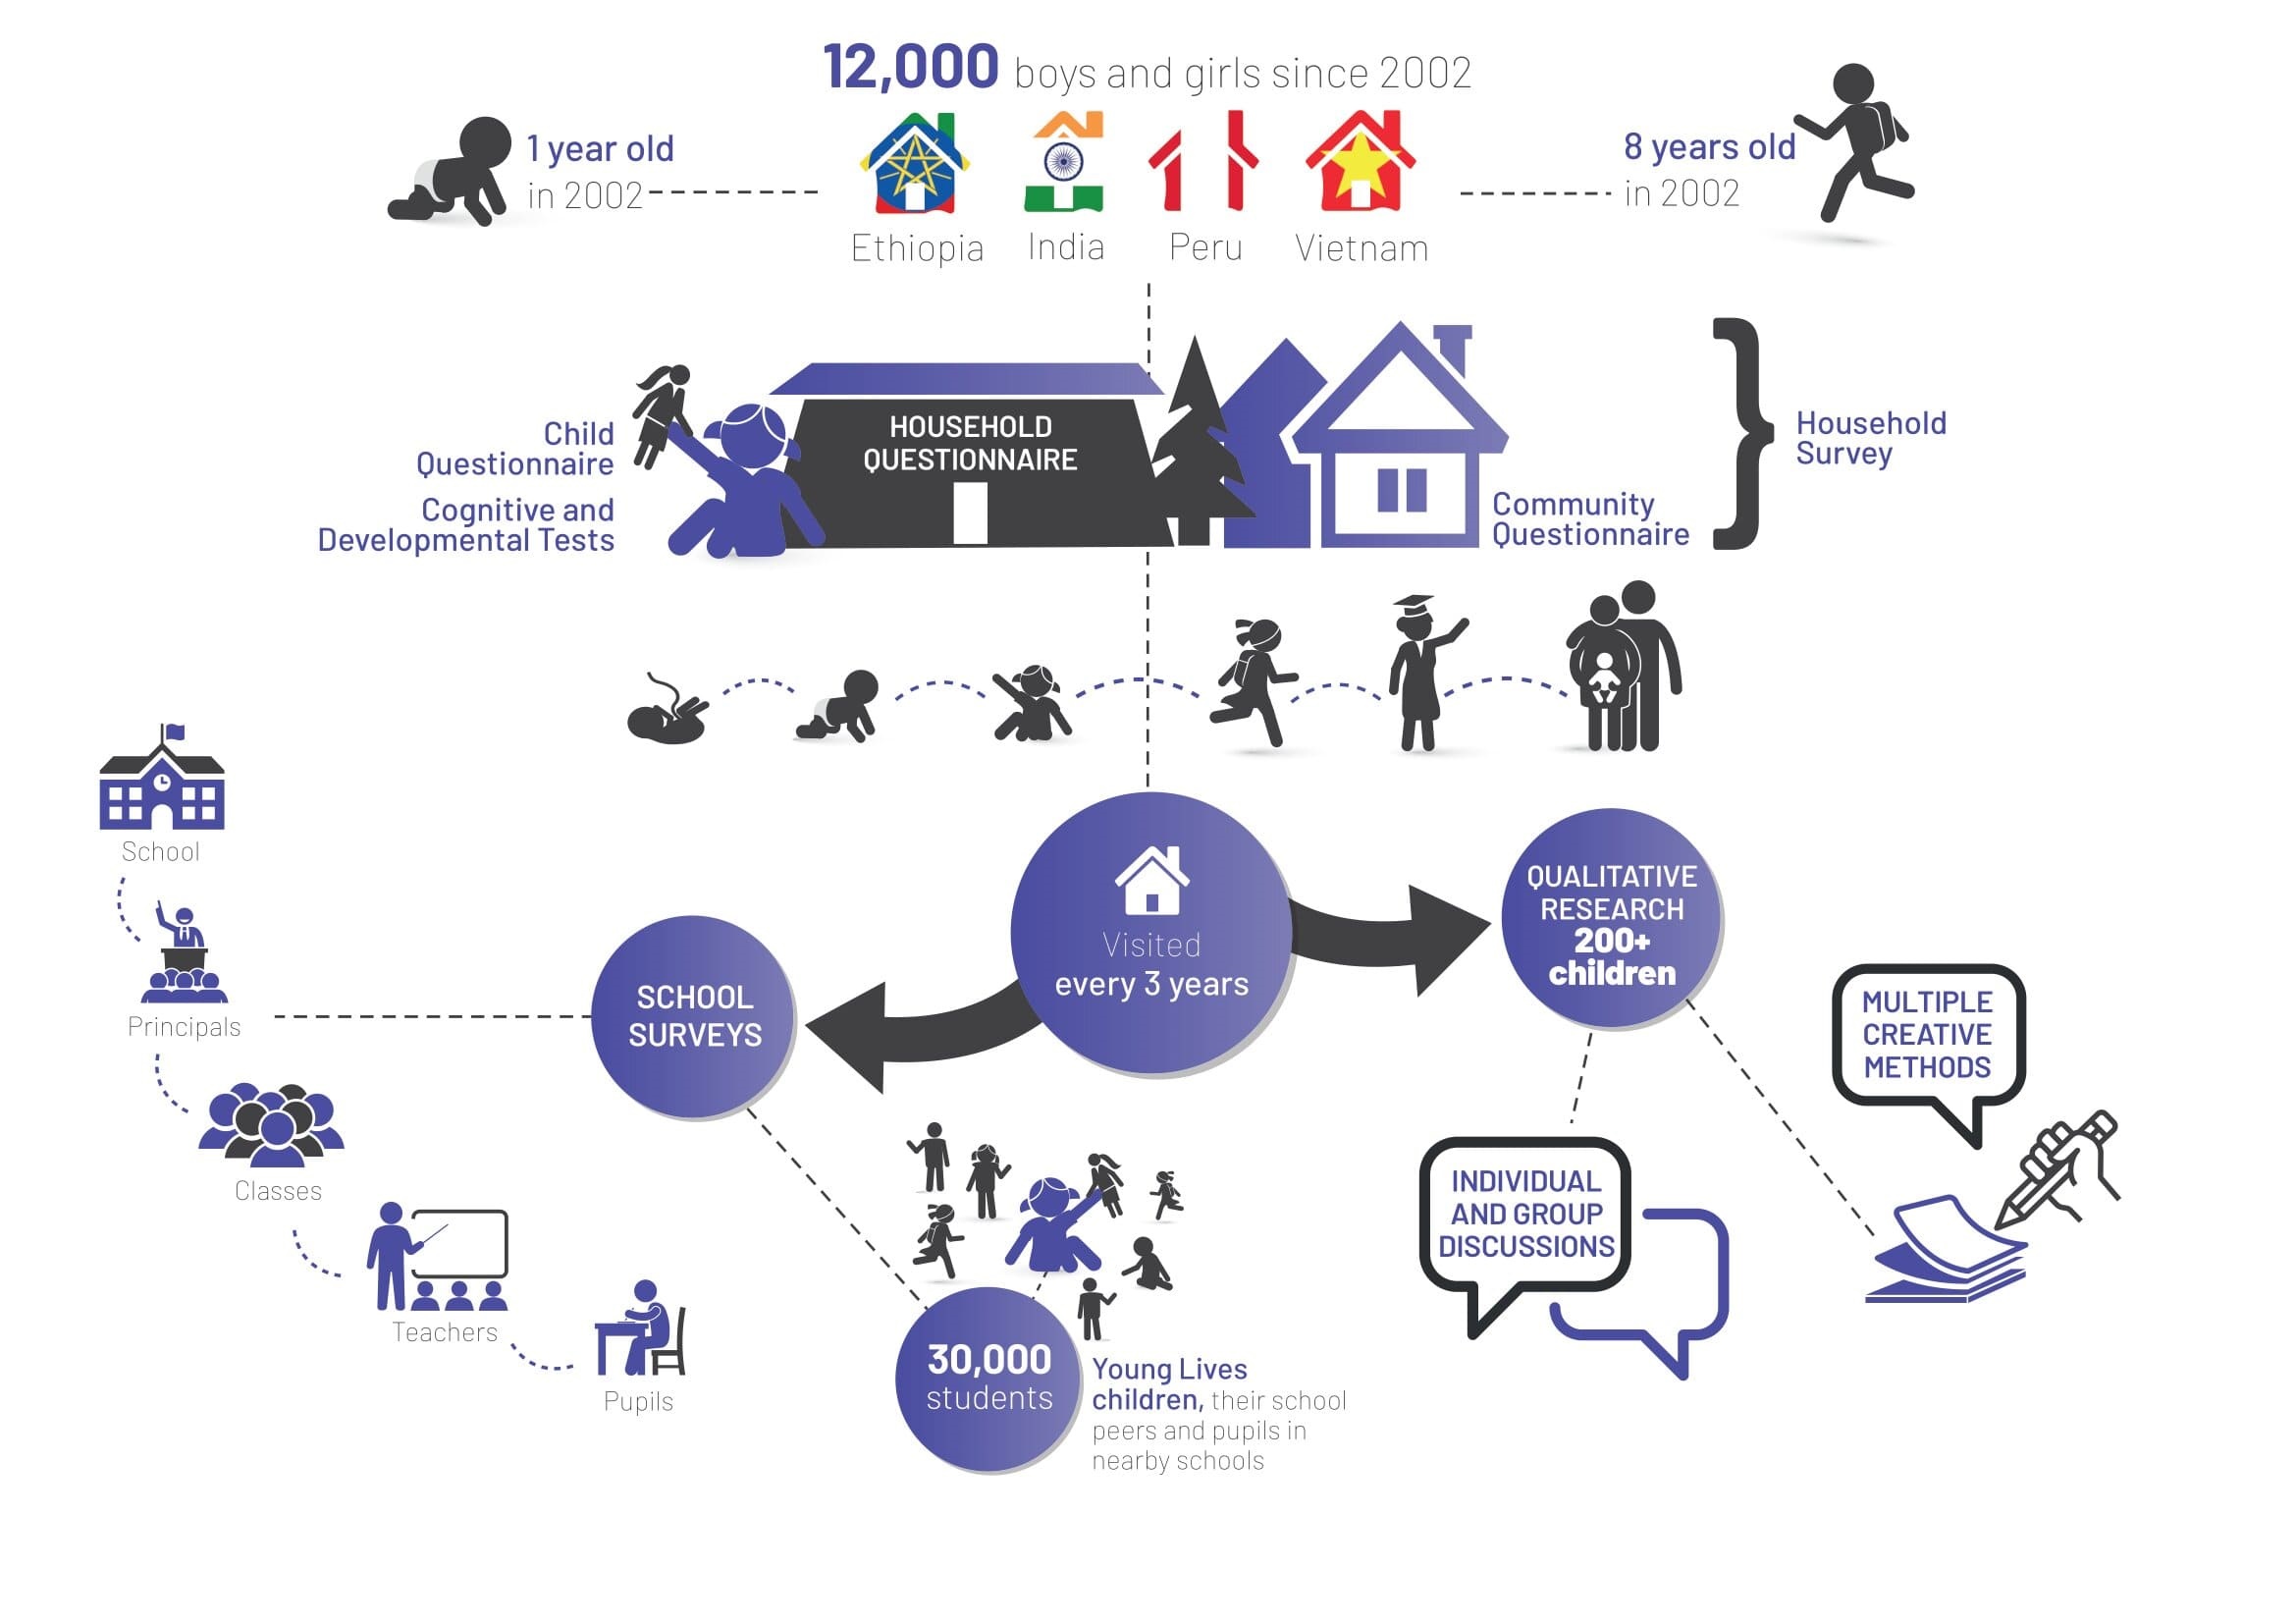
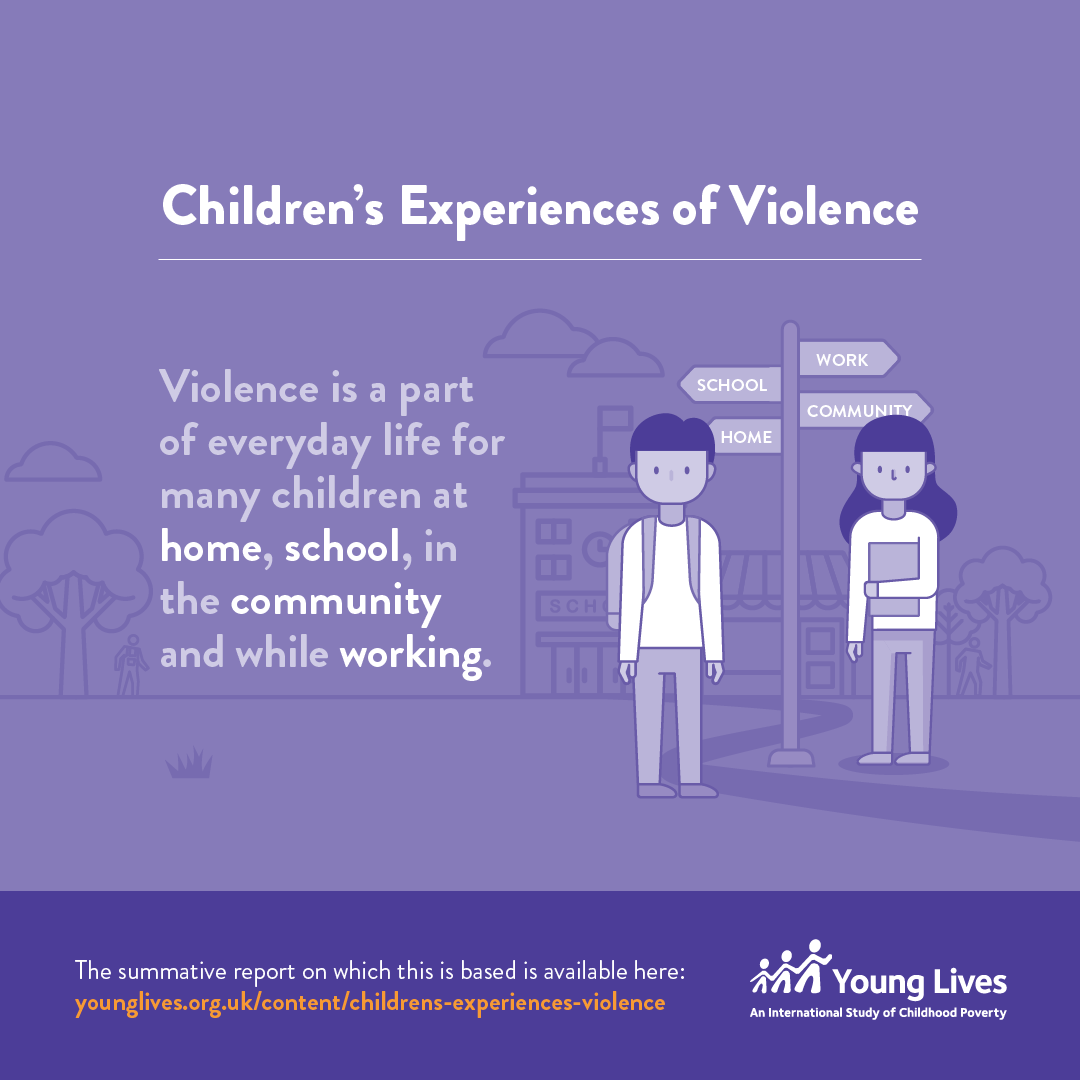
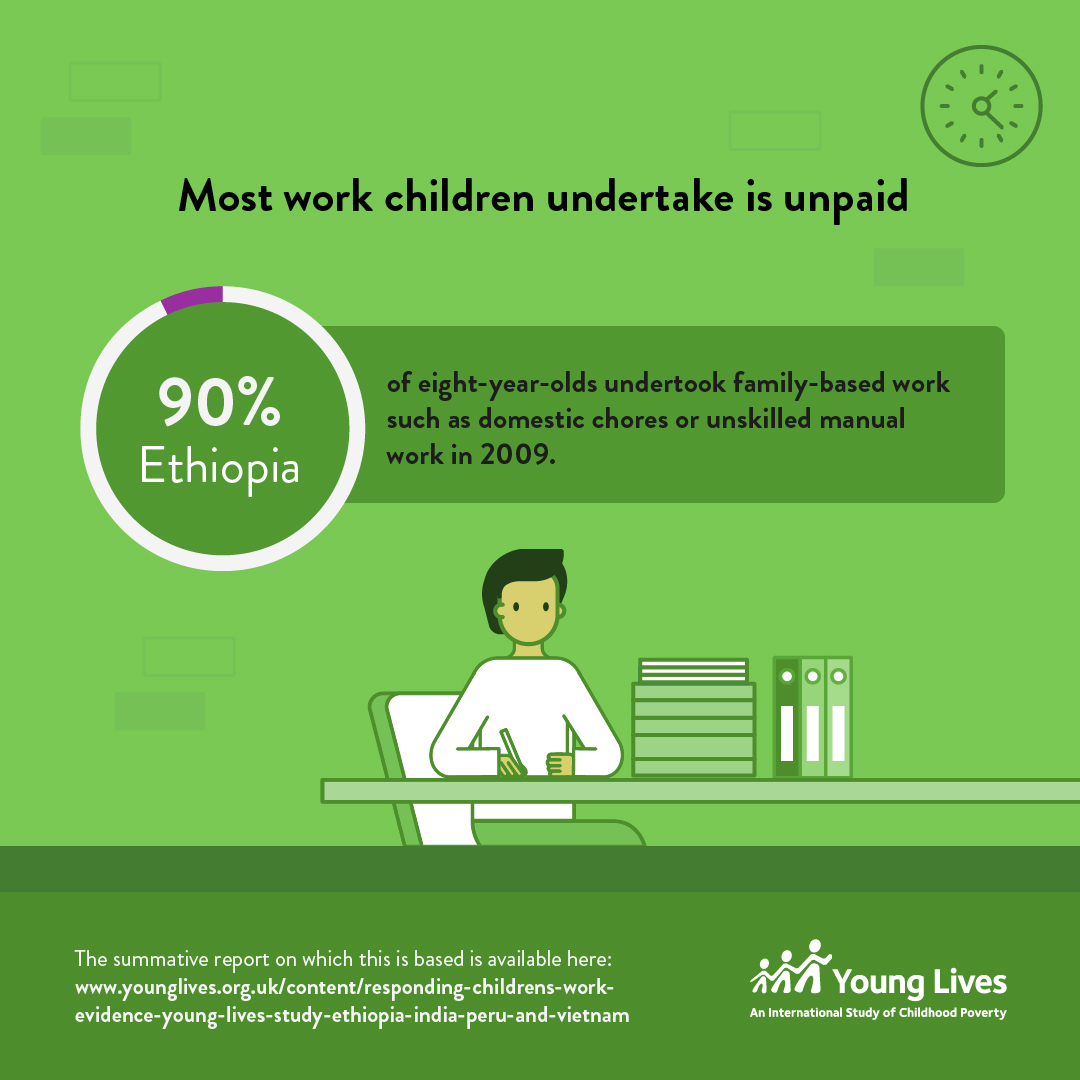
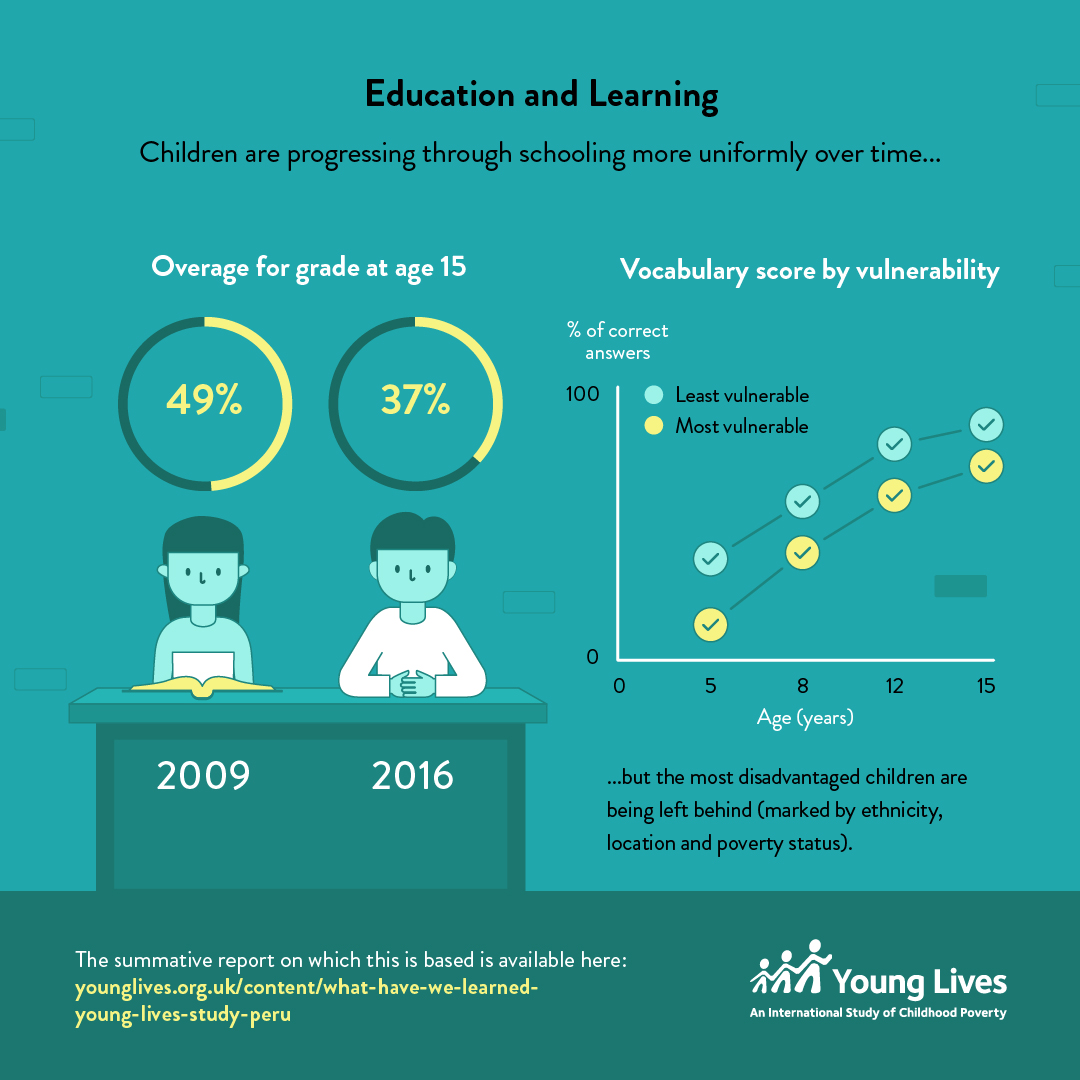
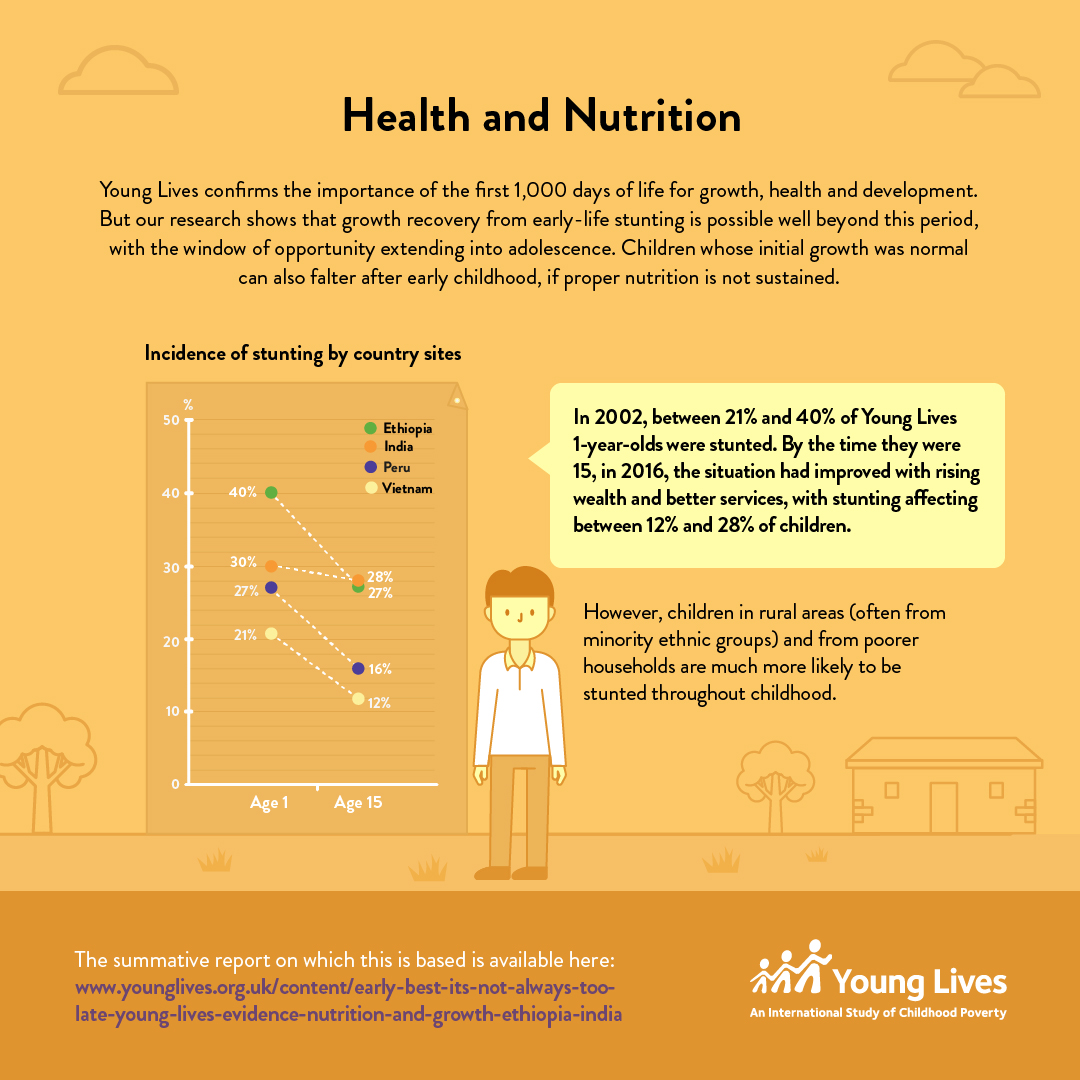
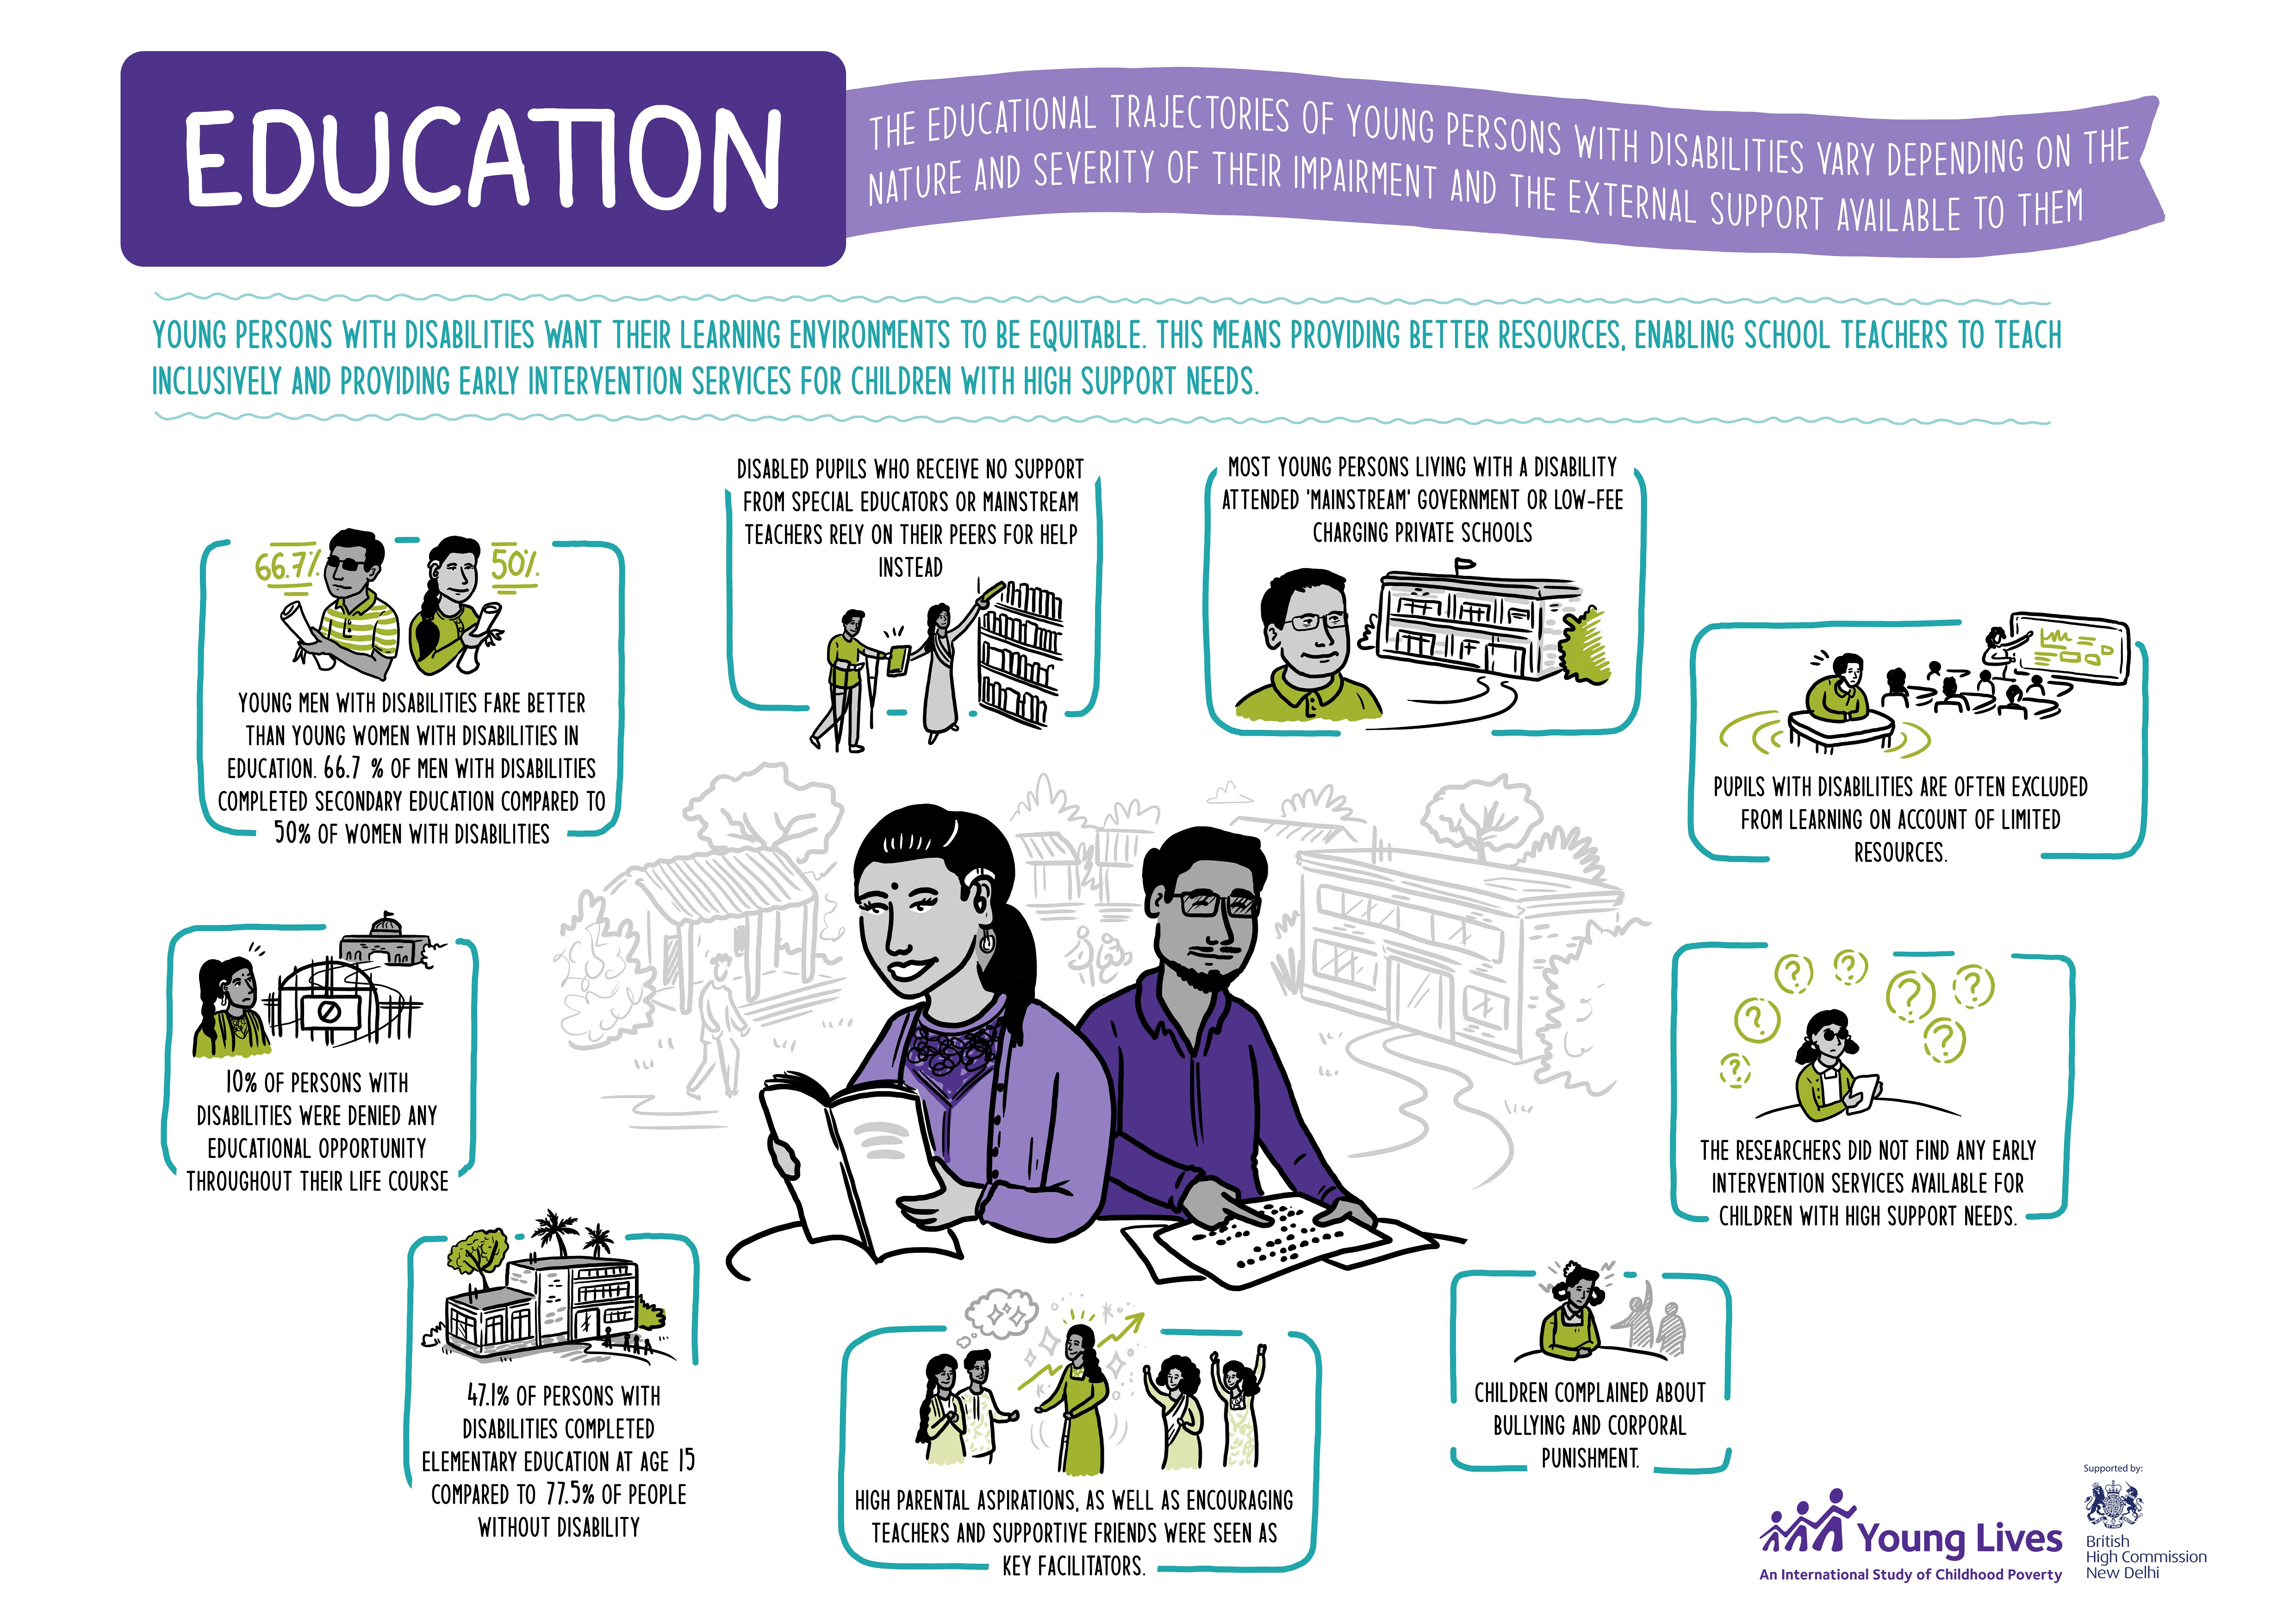
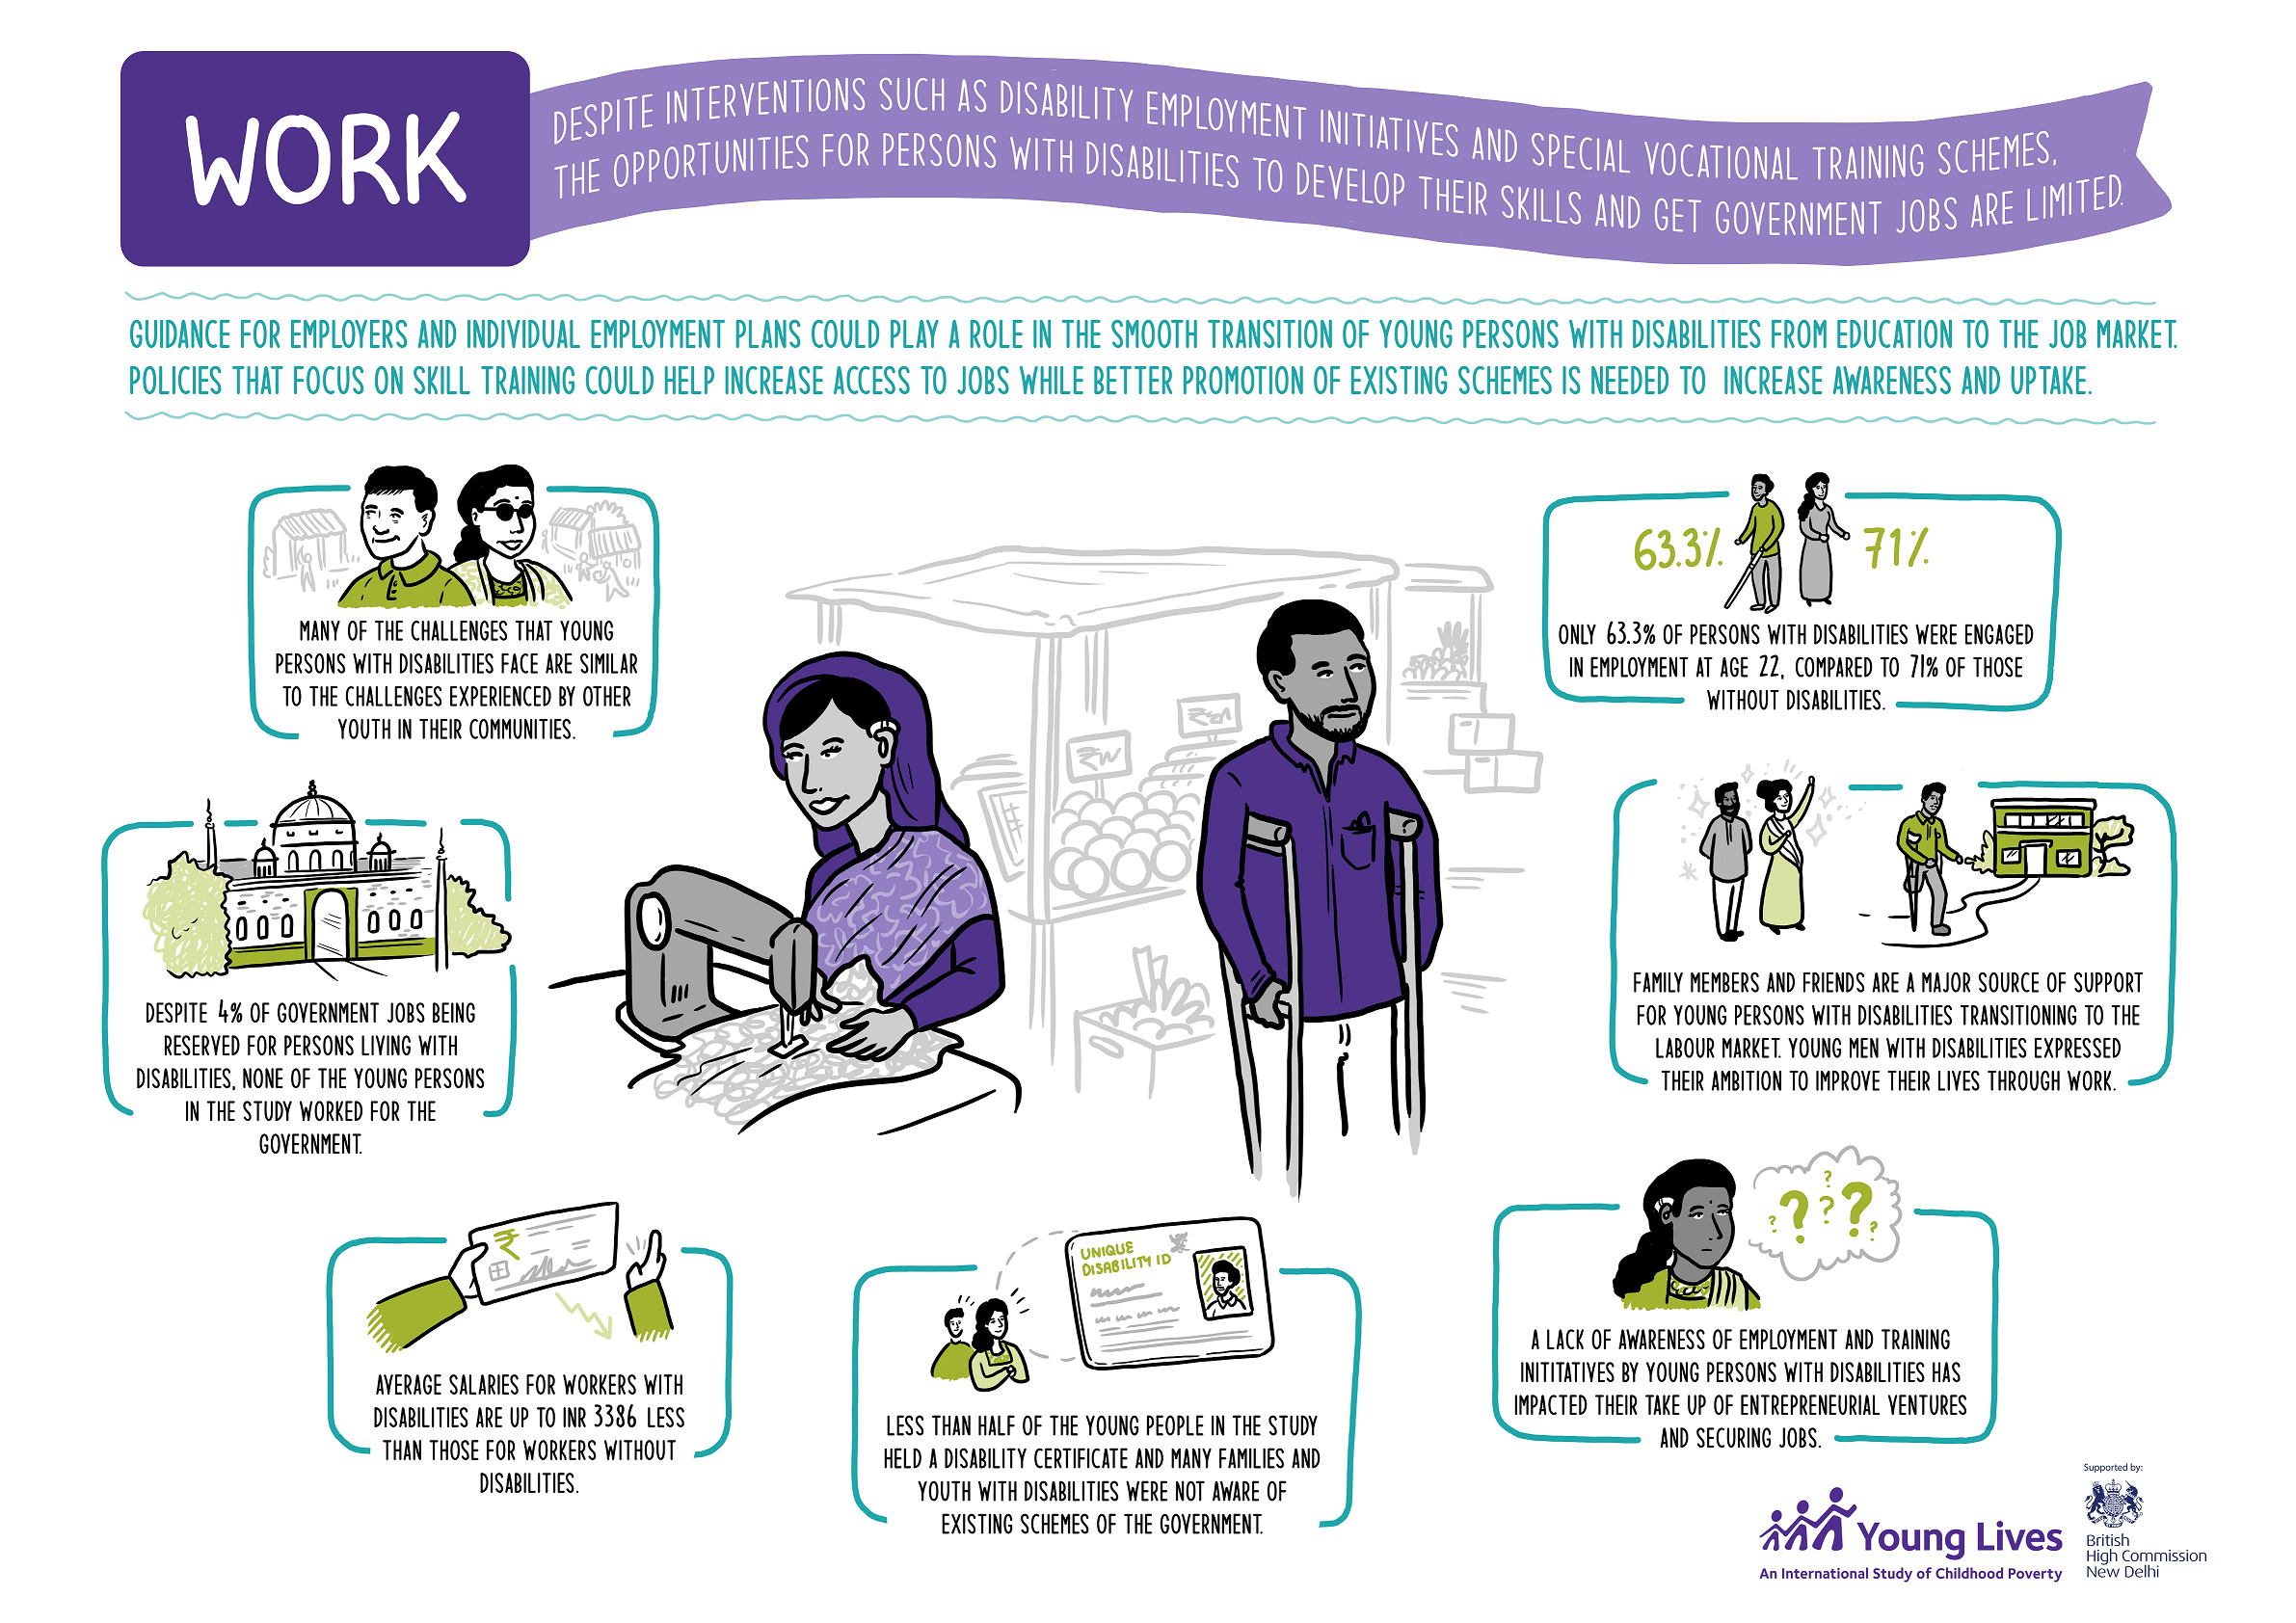
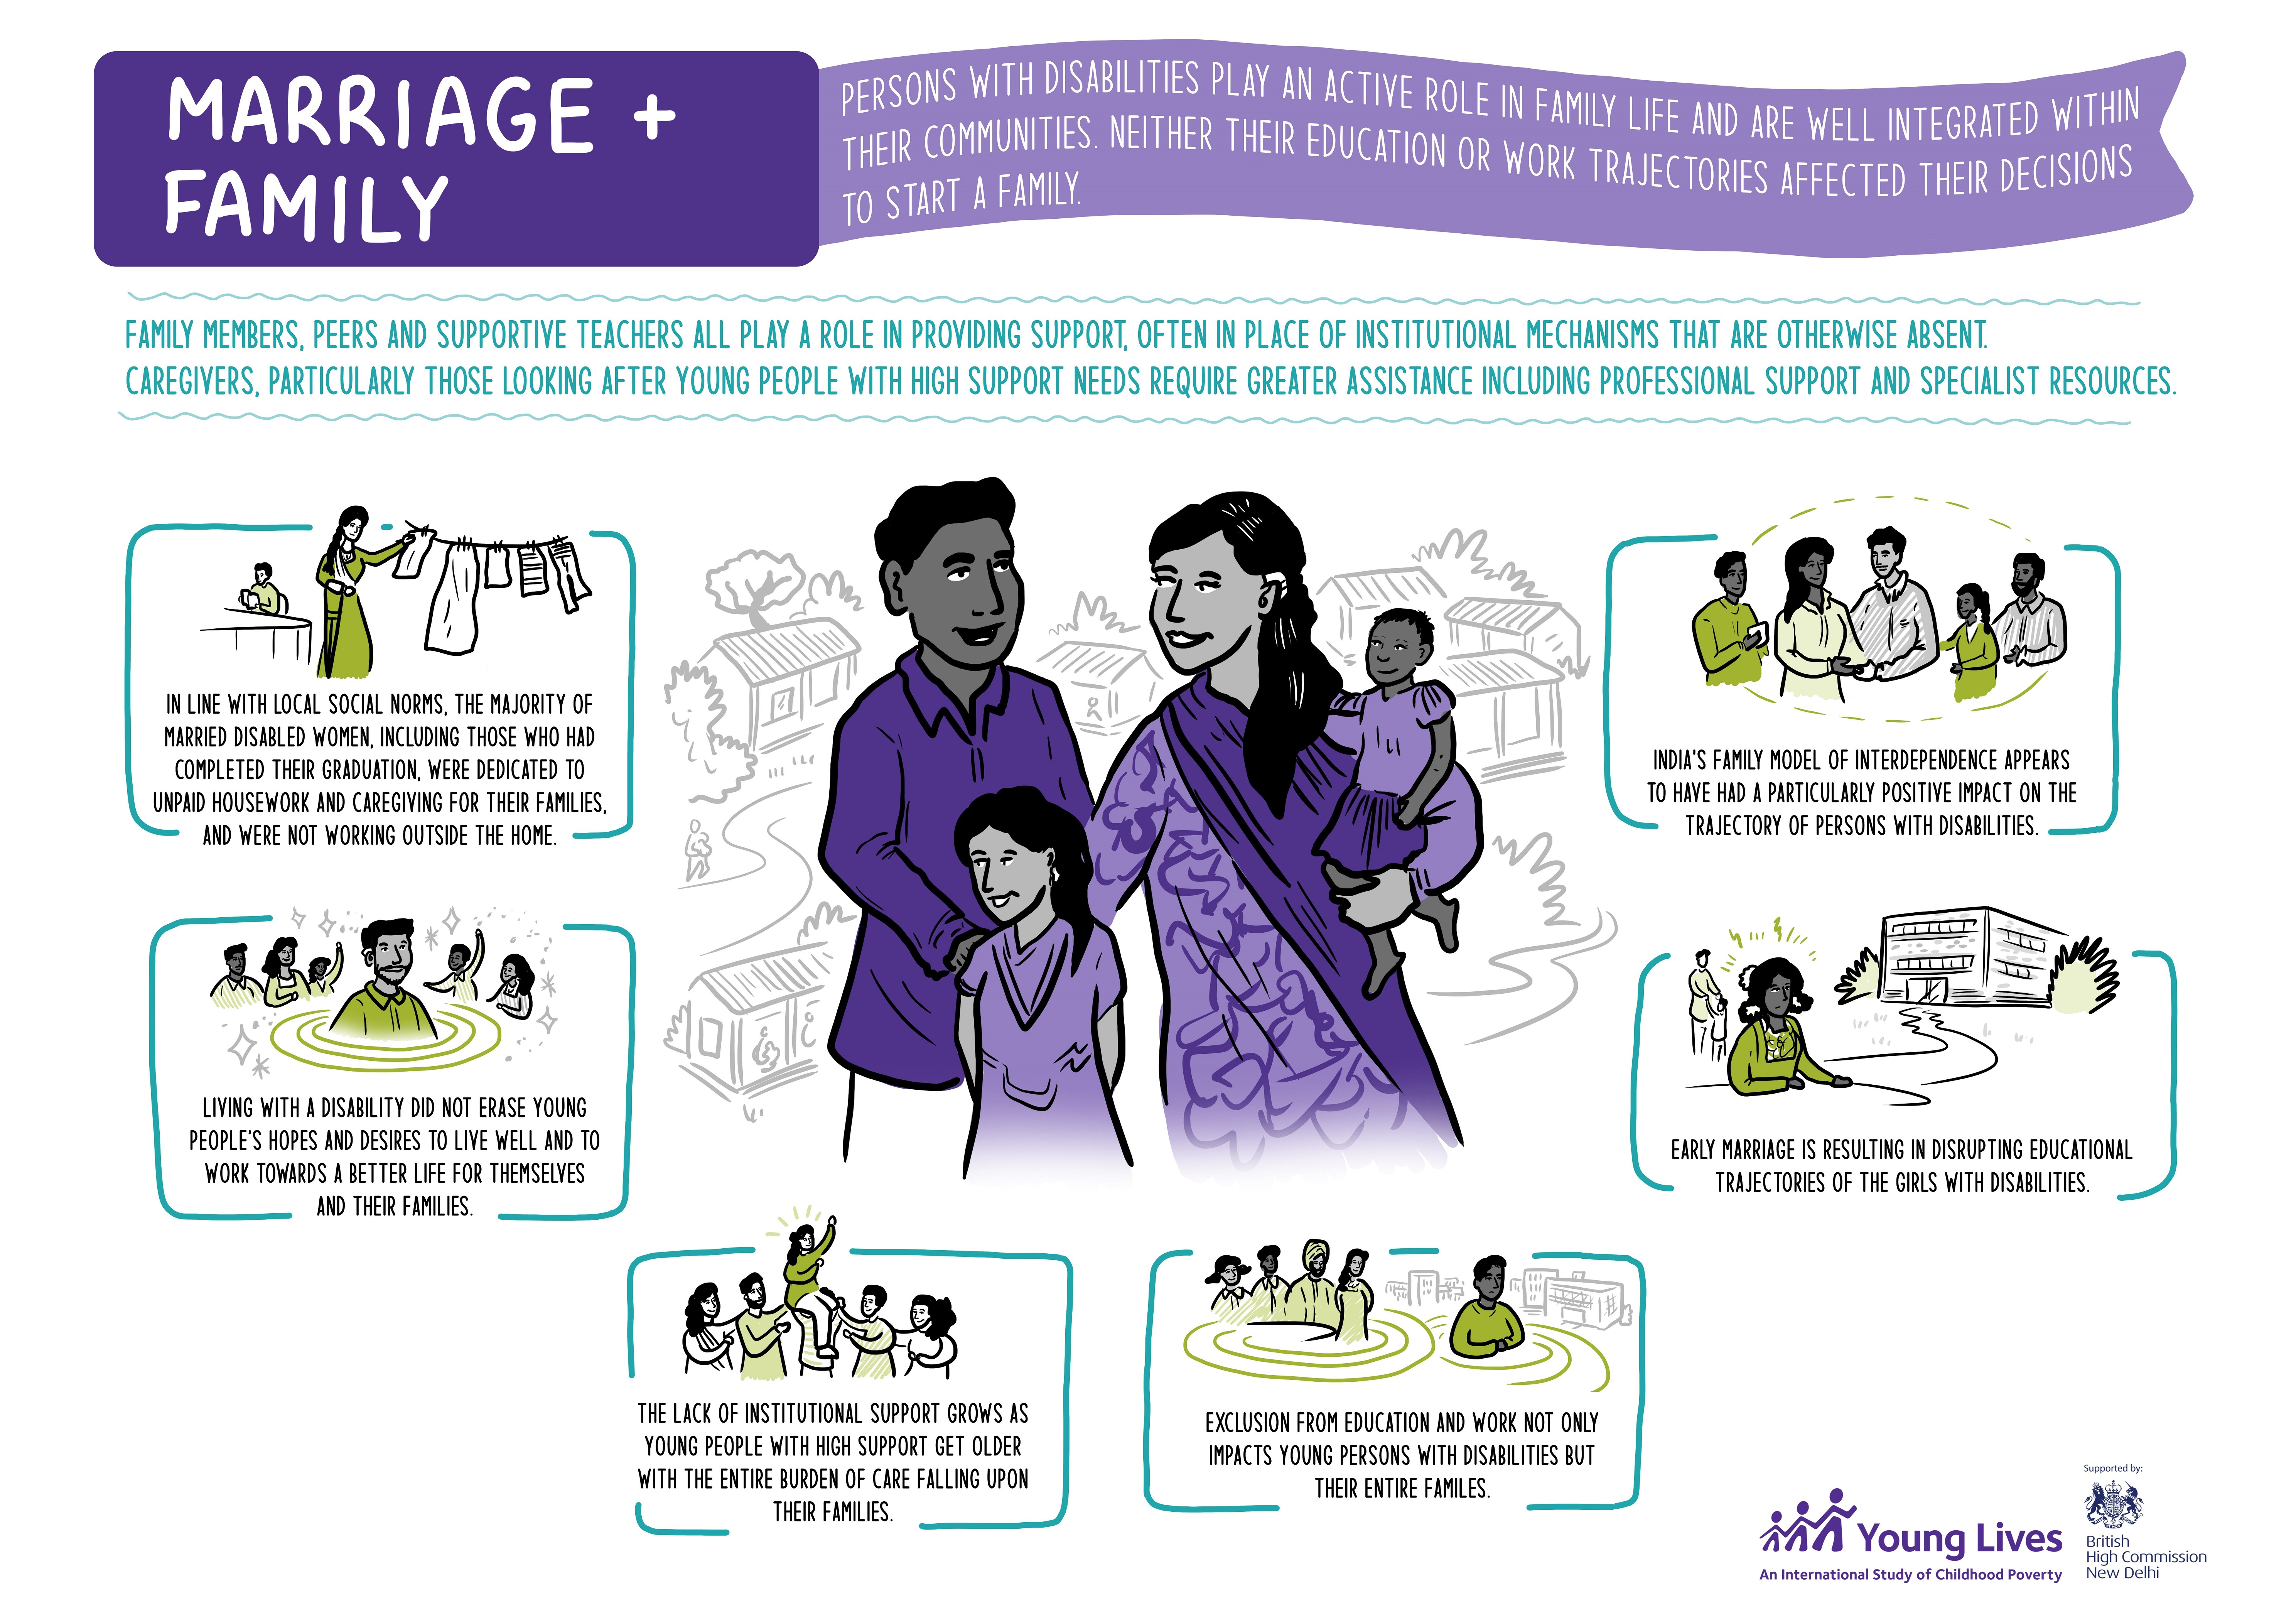
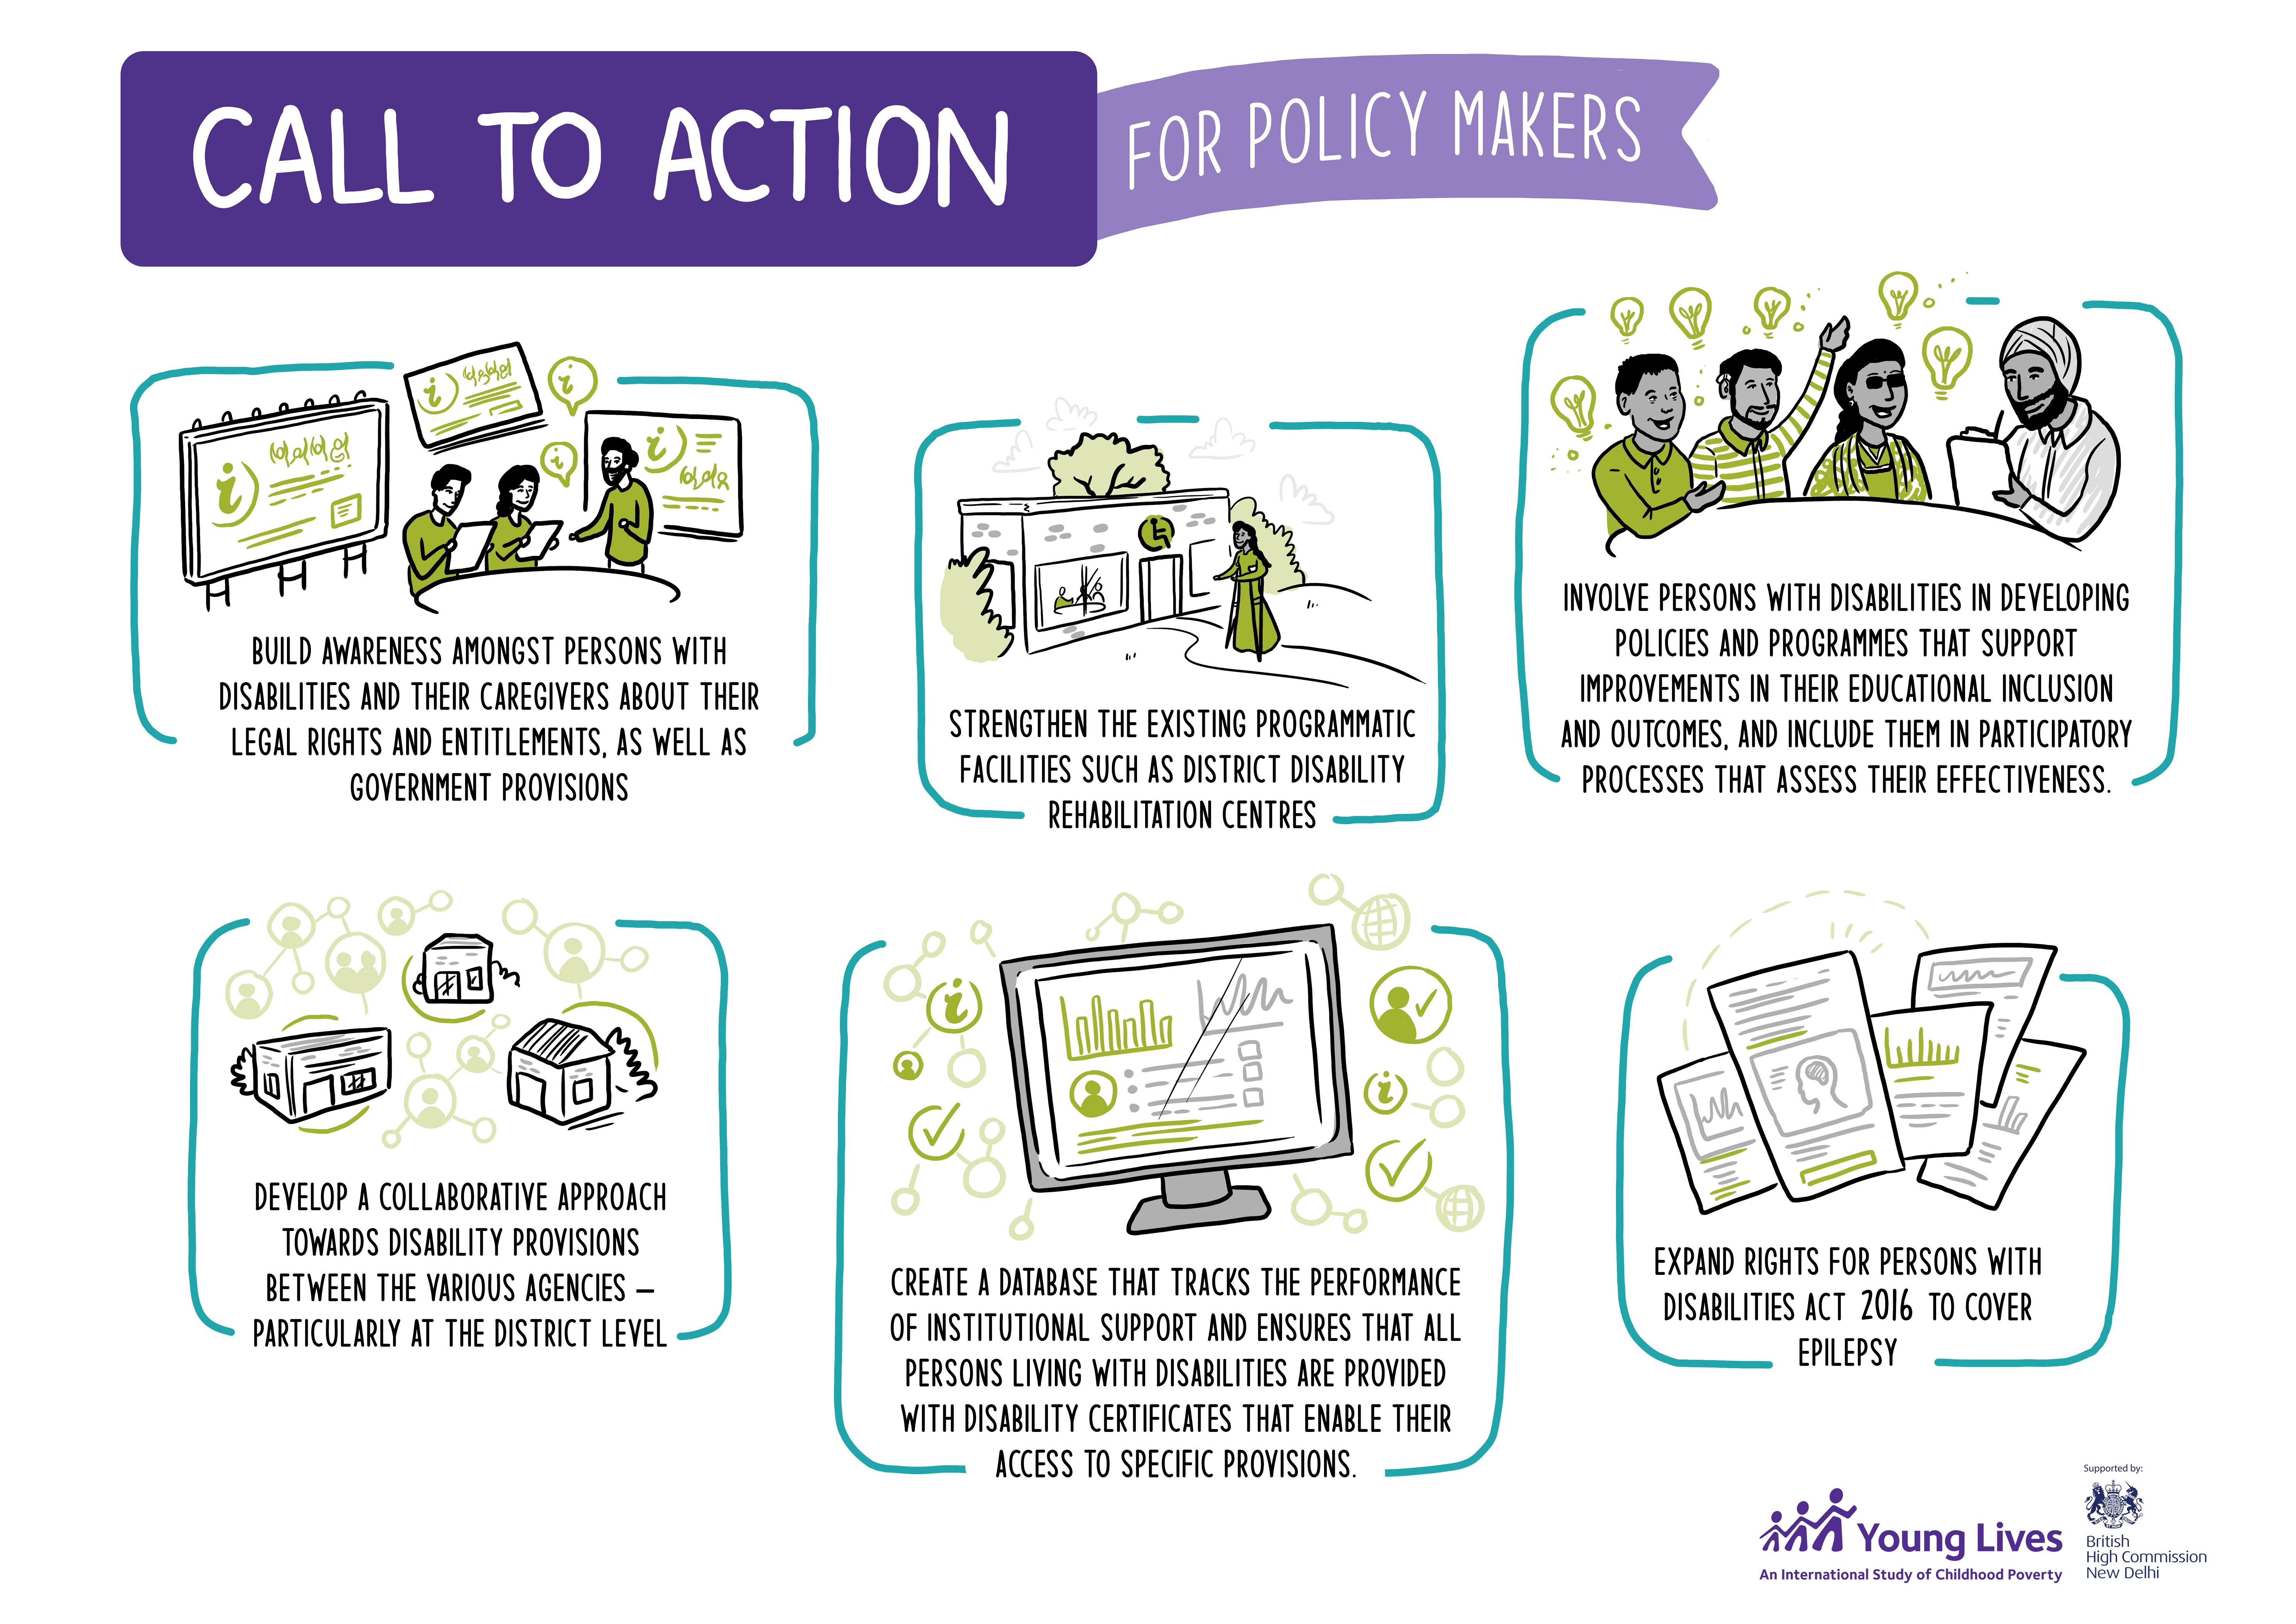
We use graphics to create a dynamic, visual representation of Young Lives’ data, research findings and policy recommendations.
Our data visualisations have been developed for research streams on nutrition, gender, education, and skills and work. They capture snapshots and progressions across our survey rounds in our four study countries..
Below you will find a selection of our data visualisations, for the full suite, please go to our Data Visualisations page.
View Young Lives' research through our creative and colourful illustrations.


