
Explore the percentage of households who had access to clean water and sanitation in each of the survey round by location:
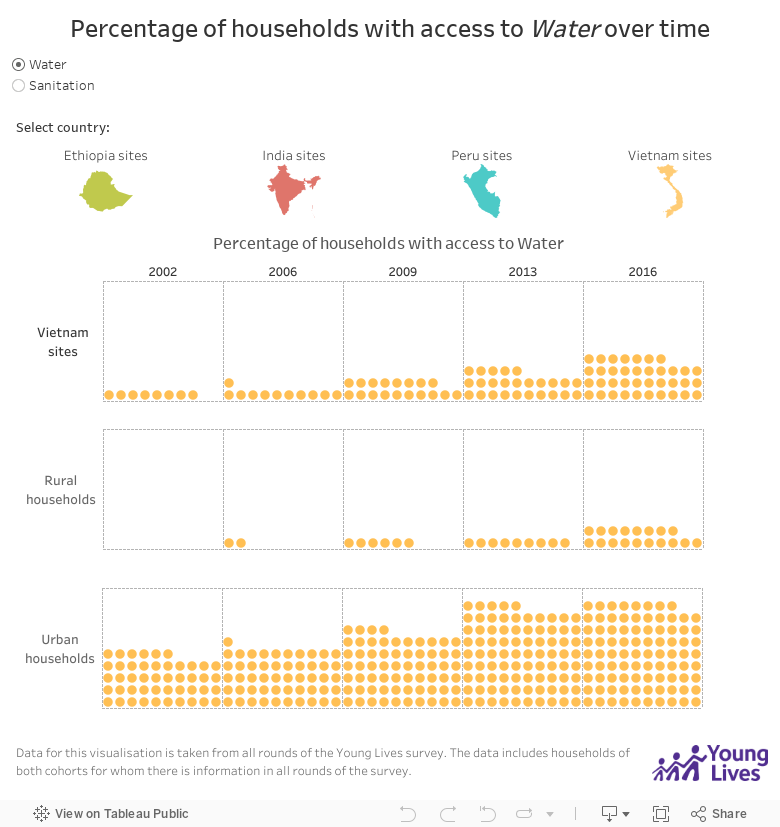
The waffle chart shows the percentages of rural and urban households that have access to water or sanitation in the selected country or year.
While it was made sure that definitions of access to safe drinking water and access of safely managed sanitation are similar across rounds and are consistent with nationally defined standards within the countries, they may not becomparable across the four study countries. For more information on how we define `safe drinking water’ and `safely managed sanitation service’ for each of the countries, please find our data dictionary below.
| Label | Description |
| Location | Household's location in round 5 (2016) survey. The sentinel sites and communities that households were sampled from in 2016 were defined as urban or rural, based on administrative definitions in each country. |
| Household wealth | Household's wealth in round 5 (2016) survey computed using the Young Lives Wealth Index disaggregated into terciles (top, middle, bottom). The Young Lives Wealth Index is a composite index measuring households' access to services such as water and sanitation, their ownership of consumer durables such as refrigerators, and the quality of floor, roof, and wall materials in their dwelling. Households in each cohort of the Young Lives survey were categorised into terciles based on their wealth index in 2002, with the households with lowest wealth belonging to the bottom tercile, and those with the highest wealth belonging to the top tercile. |
| Activity |
Studying: Average hours spent at school/college/university (including all time spent, not only attending hours, and travelling time, out and return), studying at home, and extra tuition outside the home. Working (paid): Average hours spent doing activities for pay or for money outside of household or for someone not in the household. Working (unpaid): Average hours spent doing tasks on family farm, cattle herding (household and/or community), other family business, shepherding, piecework or handicrafts done at home (not just farming). Doing domestic tasks (including caring for others): Average hours spent doing domestic tasks (fetching water, firewood, cleaning, cooking, washing, and shopping) and caring for others (younger children or ill households members). Playing: Average hours spent on leisure (playing, seeing frineds, using the internet, etc.) Sleeping: Average hours spent sleeping. |
Explore the percentage of households who had access to clean water and sanitation in each of the survey round by location:
The waffle chart shows the percentages of rural and urban households that have access to water or sanitation in the selected country or year.
While it was made sure that definitions of access to safe drinking water and access of safely managed sanitation are similar across rounds and are consistent with nationally defined standards within the countries, they may not becomparable across the four study countries. For more information on how we define `safe drinking water’ and `safely managed sanitation service’ for each of the countries, please find our data dictionary below.
| Label | Description |
| Location | Household's location in round 5 (2016) survey. The sentinel sites and communities that households were sampled from in 2016 were defined as urban or rural, based on administrative definitions in each country. |
| Household wealth | Household's wealth in round 5 (2016) survey computed using the Young Lives Wealth Index disaggregated into terciles (top, middle, bottom). The Young Lives Wealth Index is a composite index measuring households' access to services such as water and sanitation, their ownership of consumer durables such as refrigerators, and the quality of floor, roof, and wall materials in their dwelling. Households in each cohort of the Young Lives survey were categorised into terciles based on their wealth index in 2002, with the households with lowest wealth belonging to the bottom tercile, and those with the highest wealth belonging to the top tercile. |
| Activity |
Studying: Average hours spent at school/college/university (including all time spent, not only attending hours, and travelling time, out and return), studying at home, and extra tuition outside the home. Working (paid): Average hours spent doing activities for pay or for money outside of household or for someone not in the household. Working (unpaid): Average hours spent doing tasks on family farm, cattle herding (household and/or community), other family business, shepherding, piecework or handicrafts done at home (not just farming). Doing domestic tasks (including caring for others): Average hours spent doing domestic tasks (fetching water, firewood, cleaning, cooking, washing, and shopping) and caring for others (younger children or ill households members). Playing: Average hours spent on leisure (playing, seeing frineds, using the internet, etc.) Sleeping: Average hours spent sleeping. |