
Explore changes in dietary diversity between 2006 and 2016, visualised as the change in the average number of food groups consumed in a typical day:
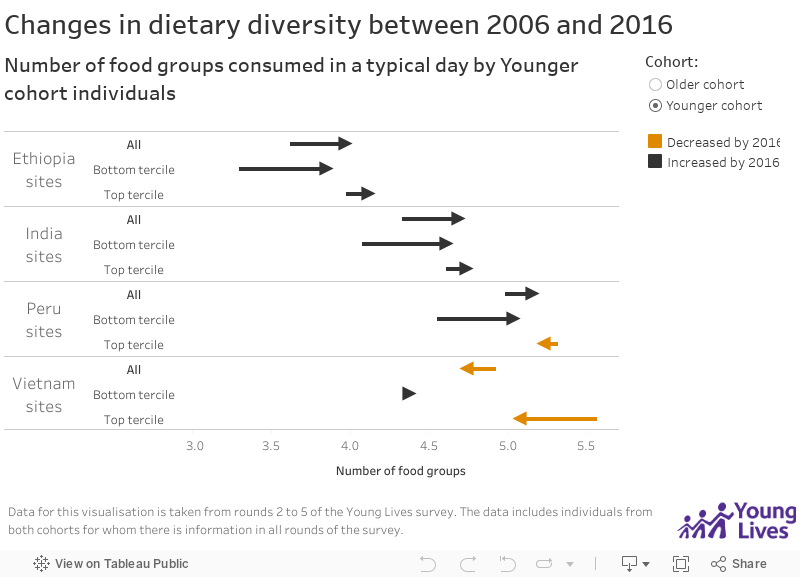
Note that this data can be visualised by cohort (Older or Younger) and household wealth index.
To visualise the change in the percentage of children consuming specific food groups in a typical day by household wealth, country sites and cohort, see the visualisation below.
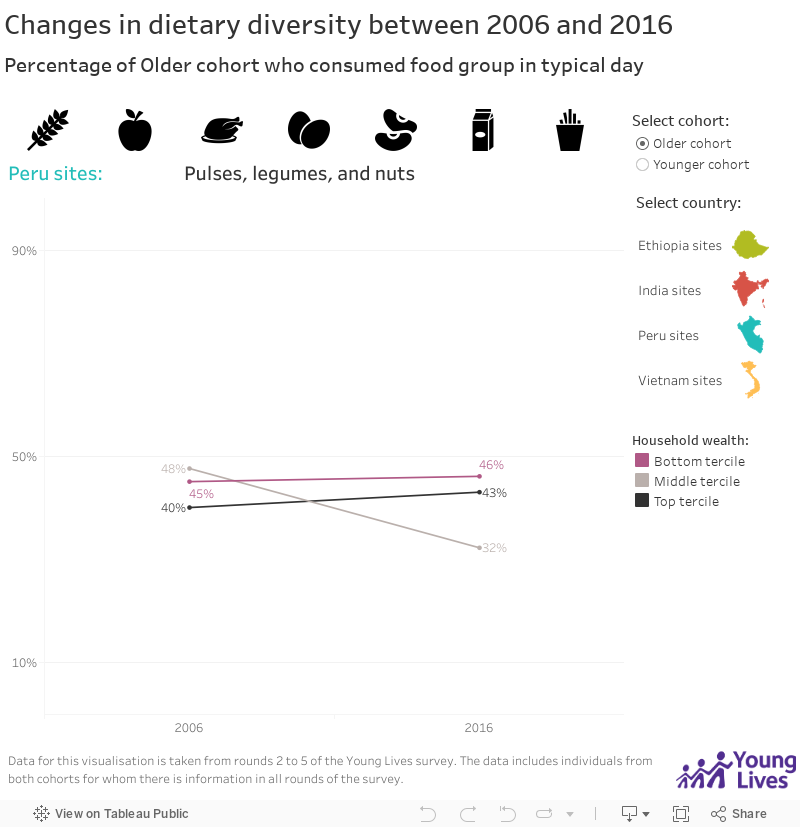
Note that this visualisation is automatically filtered to show only one country and one food group at a time, both of which can vary upon selection. This can also be explored by cohort (Older and Younger) with the different lines representing different household wealth tercile as specified in the legend.
More information on how we measure dietary diversity (number of food groups that comprise diet in the 24 hours preceding the survey interview, or a typical day), a description of food groups and explanation of household wealth terciles can be found in our working paper on food diversity in childhood here.
| Label | Description |
| Location | Household's location in round 5 (2016) survey. The sentinel sites and communities that households were sampled from in 2016 were defined as urban or rural, based on administrative definitions in each country. |
| Household wealth | Household's wealth in round 5 (2016) survey computed using the Young Lives Wealth Index disaggregated into terciles (top, middle, bottom). The Young Lives Wealth Index is a composite index measuring households' access to services such as water and sanitation, their ownership of consumer durables such as refrigerators, and the quality of floor, roof, and wall materials in their dwelling. Households in each cohort of the Young Lives survey were categorised into terciles based on their wealth index in 2002, with the households with lowest wealth belonging to the bottom tercile, and those with the highest wealth belonging to the top tercile. |
| Activity |
Studying: Average hours spent at school/college/university (including all time spent, not only attending hours, and travelling time, out and return), studying at home, and extra tuition outside the home. Working (paid): Average hours spent doing activities for pay or for money outside of household or for someone not in the household. Working (unpaid): Average hours spent doing tasks on family farm, cattle herding (household and/or community), other family business, shepherding, piecework or handicrafts done at home (not just farming). Doing domestic tasks (including caring for others): Average hours spent doing domestic tasks (fetching water, firewood, cleaning, cooking, washing, and shopping) and caring for others (younger children or ill households members). Playing: Average hours spent on leisure (playing, seeing frineds, using the internet, etc.) Sleeping: Average hours spent sleeping. |
Explore changes in dietary diversity between 2006 and 2016, visualised as the change in the average number of food groups consumed in a typical day:
Note that this data can be visualised by cohort (Older or Younger) and household wealth index.
To visualise the change in the percentage of children consuming specific food groups in a typical day by household wealth, country sites and cohort, see the visualisation below.
Note that this visualisation is automatically filtered to show only one country and one food group at a time, both of which can vary upon selection. This can also be explored by cohort (Older and Younger) with the different lines representing different household wealth tercile as specified in the legend.
More information on how we measure dietary diversity (number of food groups that comprise diet in the 24 hours preceding the survey interview, or a typical day), a description of food groups and explanation of household wealth terciles can be found in our working paper on food diversity in childhood here.
| Label | Description |
| Location | Household's location in round 5 (2016) survey. The sentinel sites and communities that households were sampled from in 2016 were defined as urban or rural, based on administrative definitions in each country. |
| Household wealth | Household's wealth in round 5 (2016) survey computed using the Young Lives Wealth Index disaggregated into terciles (top, middle, bottom). The Young Lives Wealth Index is a composite index measuring households' access to services such as water and sanitation, their ownership of consumer durables such as refrigerators, and the quality of floor, roof, and wall materials in their dwelling. Households in each cohort of the Young Lives survey were categorised into terciles based on their wealth index in 2002, with the households with lowest wealth belonging to the bottom tercile, and those with the highest wealth belonging to the top tercile. |
| Activity |
Studying: Average hours spent at school/college/university (including all time spent, not only attending hours, and travelling time, out and return), studying at home, and extra tuition outside the home. Working (paid): Average hours spent doing activities for pay or for money outside of household or for someone not in the household. Working (unpaid): Average hours spent doing tasks on family farm, cattle herding (household and/or community), other family business, shepherding, piecework or handicrafts done at home (not just farming). Doing domestic tasks (including caring for others): Average hours spent doing domestic tasks (fetching water, firewood, cleaning, cooking, washing, and shopping) and caring for others (younger children or ill households members). Playing: Average hours spent on leisure (playing, seeing frineds, using the internet, etc.) Sleeping: Average hours spent sleeping. |