
Publication Information
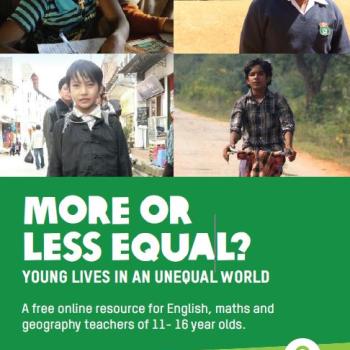
With separate sessions in Geography, Maths and English, More or Less Equal? can be used in both a subject-specific and cross-curricular way. The resources include a wide range of participatory activities to engage learners (age 11 to 16) with the wider world and help them make links between the local and the global. In all subject areas, learners will explore how inequality and poverty affect the lives of children in different parts of the world, including the UK. Created in partnership with Oxfam GB and with the support of teacher subject associations.
Use real-life data to develop a range of mathematical skills in using fractions, decimals and percentages, in problem solving and in data handling. Interpret data presented in different ways and use statistics to create graphs and charts. More or Less Equal? is based on data gathered in Ethiopia, India, Peru and Viet Nam by Young Lives, an international research project exploring the effects of poverty on young people for 15 years.
More or Less Equal? can be downloaded from the Oxfam Youth and Education website. The resource includes:
Teachers’ overview: Includes an introduction, a detailed resource outline and a template for learners to record their key learning from each session. Background notes for teachers: Further information about inequality, Young Lives and the four Young Lives study countries (Ethiopia, India, Peru and Viet Nam). Introduction: Welcome to Young Lives: Consider what development and inequality mean and meet the young people featured in 'More or Less Equal?' Introduction: Thinking about the Sustainable Development Goals: An optional activity to investigate the Sustainable Development Goals and think critically about the goal themes. Session 1: Measuring inequality:: Develop understanding of number and ratio and investigate the wealth of the world’s richest and poorest people. Measure and compare in-country income inequality in five countries. Session 2: Measuring development: Explore what development means and the different ways of measuring it. Play 'Development Trumps' and then use scatter graphs to explore relationships between different development indicators. Session 3: In-country gaps 1: Consider the importance of using a large sample size when collecting data and use frequency distribution tables to calculate the mean, mode and median for young people’s time use. Session 4: In-country gaps 2: Use pie charts to compare your daily time use with that of some young people from the four Young Lives countries. Explore how gender and place of residence (urban or rural) can affect time use. Session 5: Between-country gaps: Investigate development indicators in more detail and present data in different ways by converting between percentages and fractions. Generate statements about the data. Session 6: Changing gaps over time: Explore how some development indicators have changed over time and represent these using line graphs. Discuss how and why indicators have changed and make predictions for the future. Comparing development indicators: An Excel spreadsheet of the ‘Development Trumps’ data for learners to use. Maths Slideshow A: For use with sessions 1–3. Maths Slideshow B: For use with English sessions 4–6. Reflecting and sharing: Think critically about what can be done to tackle extreme inequality in our world. Reflect on learning about poverty and inequality and work with others to plan an activity to share learning with others.